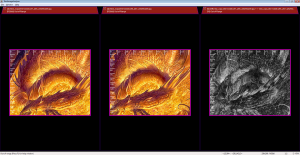
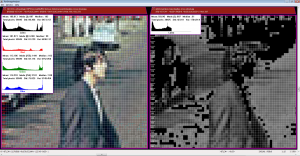
Compare mode with image difference
The basic essence of the utility is to allow an easy side-by-side view of images (that share the same dimensions) so it will be easy to look at them (press ‘L’ to move to layer mode).
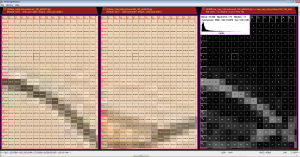
Compare mode with pixel value inspection
One of the strengths of the utility is the ability to inspect per-pixel value and zoom the images up to x100 of their original size. If you need to inspect your images or aspire to bit-exact (b2b) analysis – this is the way to go…
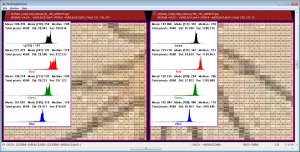
Histogram view in compare mode
The histogram view shows an image statistical info with an emphasize on histogram data.
It’s key-feature is allowing user browsing of the histogram bins and reflecting a
per-channel info.
When the overlay is on, all regular user-actions are in order and the info will be updated accordingly.
This is specially useful when working with ROI as the current view always reflects the current active ROI, whereas non-active ROI simply displays info for the entire image.
Note that when an image is filtered, only the unmasked pixels (visible) are part of the statistics / histogram view data.
Image Evaluating using I-Eval
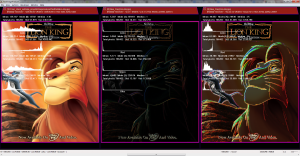
To enhance your analyzing process, you can use the I-Eval engine to produce most possible image manipulations.
In this example, we used these 2 I-Eval expressions:
{ abs(i-i[x-1,y-1]]) } { i1*1.3*(i2 > 10)+i1/4*(i2 <= 10) }
This yields diagonal XY gradient on image 2 which is piped to the 2nd I-Eval that simply enhances the pixels that have gradient bigger than 10 and dims those that aren’t by a factor of 4.
You can use this later to compare or further manipulate your images…
Filtered image
Example of converting an image into gray scale and filtering (masking) part of the luma values (lower half).
You can see the grid mode is aware of the actual filtered colors, making it easier to distinguish the area.

